


- 1
- 2
- 3
- 4
- HFSS15�ھ�����
- ���
- HFSS�̌W
- HFSS 15 �ھ������ęn
Creating Reports
Modifying Reports
To modify the data that is plotted in a report:
1. In the project tree, click the report you want to modify.
2. Right-click Modify Report.
The Report dialog appears.
3. The Report dialog command buttons permit you create a new report with the settings you provide, or to modify an existing report.
• Output Variables - opens the Output Variables dialog.
• Add Trace - this is enabled when you have created or selected a report. Add one or more traces to include in the report.
• Update Trace - updates the selected traces in a report based on further processing or changes.
• New Report - adds a report to the Project tree under the Results icon. The new Report is displayed in the main window.
• Options - opens the Report Setup Options dialog. This contains a checkbox for using the advanced mode for editing and viewing trace components. This mode is automatic if the trace requires it. It also contains a field for setting the maximum number of significant digits to display for numerical quantities.
• Close - closes the Report dialog.
The updated report appears in the view window.
4. Update Report setting
• Real Time checked -- enable real time updates for all reports while the reports are being edited.
• Real Time unchecked -- enables drop down menu to Update All Reports or Update Report. Reports will only be updated with one of these user selectable update options or upon exiting the report dialog. This can be useful if you expect a trace to take time to display. You can then add additional traces without having to wait.
5. In the Context section you make selections depending on the design and solution type.
6. The Families tab provides a way to select from valid solutions for sweeps where a simulation has multiple variables defined (for example, for a parametric sweep). If so, the variables other than the one chosen as the X (Primary sweep), are listed under the Families tab with columns for the variable, the value, and an Edit column with an ellipsis [...] button. See Using Families tab for Reports.
7. In the Y Component section of the dialog make selections for the following:
a. Categories - those depend on the Solution type and the design. For example, Eigenmode quantities include Eigenmodes, variables, output variables, and the design. Driven solutions include such categories as S parameters. Report categories for Transient designs include Spectral and Transient. For a Transient Network design with differential pairs defined, the Reporter interface allows selection of single-ended or differential signals just as for driven terminal.
b. Quantities for Y are relative to the selected category.
Note |
The Quantity text field can be used to filter the Quantity list by typing in text, or by using the four predefined selections. This is useful if the Category selected produces a lengthy Quantities list. See Filtering Quantity Selections for the Reporter. When the matrix is very large, the number of quantities can be correspondingly huge. Therefore, the Quantities field can optionally use a tree structure to divide matrix quantities into groups by their first element name. The initial display shows groups, without initially listing group members. See Report Setup Options. |
c. Function list to apply to the Y quantities.
d. Value field displays the currently specified Quantity and Function. You can edit this field directly.
Note |
Color shows valid expression. |
e. Range Function button -- opens the Set Range Function dialog. This applies currently specified Quantity and Function.
8. In the X (Primary Sweep) section, make selections for the following:
a. Select the Primary value(s) from the drop down menu.
To select an X component that is different than the Primary Sweep, uncheck the Default field to enable the X field and browse [...] button. Click the browse [...] button to display the Select X Component dialog.
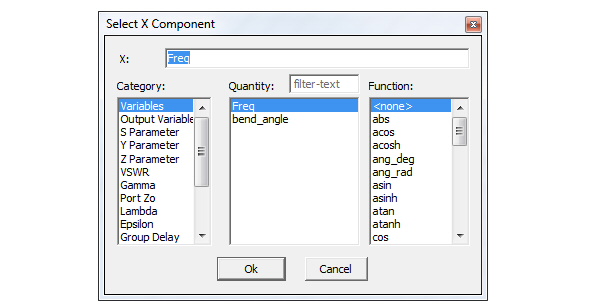
This lets you specify the X component as you do the Y; that is, in terms of Categories which define the selectable Quantities, and Functions to apply. After making selections, OK the dialog to assign the X component.
b. If sweeps are available, you can select the browse [...] button to display a panel that that lets you select Use all values, or selected sweep or sweeps, or access an Edit Sweep dialog. with further editing options. Post-Processing variables are Post-Processing sweeps/editable sweeps, so you can use the Edit Sweep dialog to create your own sweep.
c. The Families tab provides a way to select from valid solutions for sweeps where a simulation has multiple variables defined (for example, for a parametric sweep). If so, the variables other than the one chosen as the X (Primary sweep), are listed under the Families tab with columns for the variable, the value, and an Edit column with an ellipsis [...] button. See Using Families tab for Reports.
You can also view and edit the properties of Reports and their traces via their Properties windows. See Modifying the Background Properties of a Report.
You can also modify the display type of an existing plot from the Properties dialog for that plot. Select the Report icon in the Project tree to display the Properties dialog. Selecting the Display Type field displays a menu with selections available for that plot.
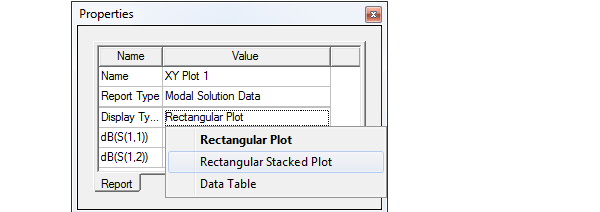
Once you make a selection, the plot display updates for the current selection.
Note |
Remember that for many excitations of interest for plotting, you can control the default base names through the dialog described here: Setting Default Boundary/Excitation Base Names. This may save you the need to edit individual names in the plots. |
Related Topics
Selecting the Report Type in HFSS Transient
Zooming and Fitting Reports
Modifying the Background Properties of a Report
Modifying the Legend in a Report
Creating Custom Report Templates
Report Setup Options (for maximum significant digits and drag and drop behavior)
Working with Traces
Editing the Display Properties of Traces
Setting Default Boundary/Excitation Base Names
Discarding Report Values Below a Specified Threshold
Add Trace Characteristics
Adding Data Markers to Traces
Perform FFT on a Report
-

������ȫ���HFSS��Ӗ�n�̣�����7��ҕ�l�̳̺�2���̲ģ��Y����v�⣬ҕ�l������ʾ���Y�����¹��̰�����HFSS�W�������y...��Ԕ����B��